5 min read
How to Build an HVAC Brand That Doesn't Blow Cold Air
Build a standout HVAC brand with expert Branding for HVAC tips: logos, consistency, digital activation & ROI strategies for 2026 growth.
Read more

May 24, 2026
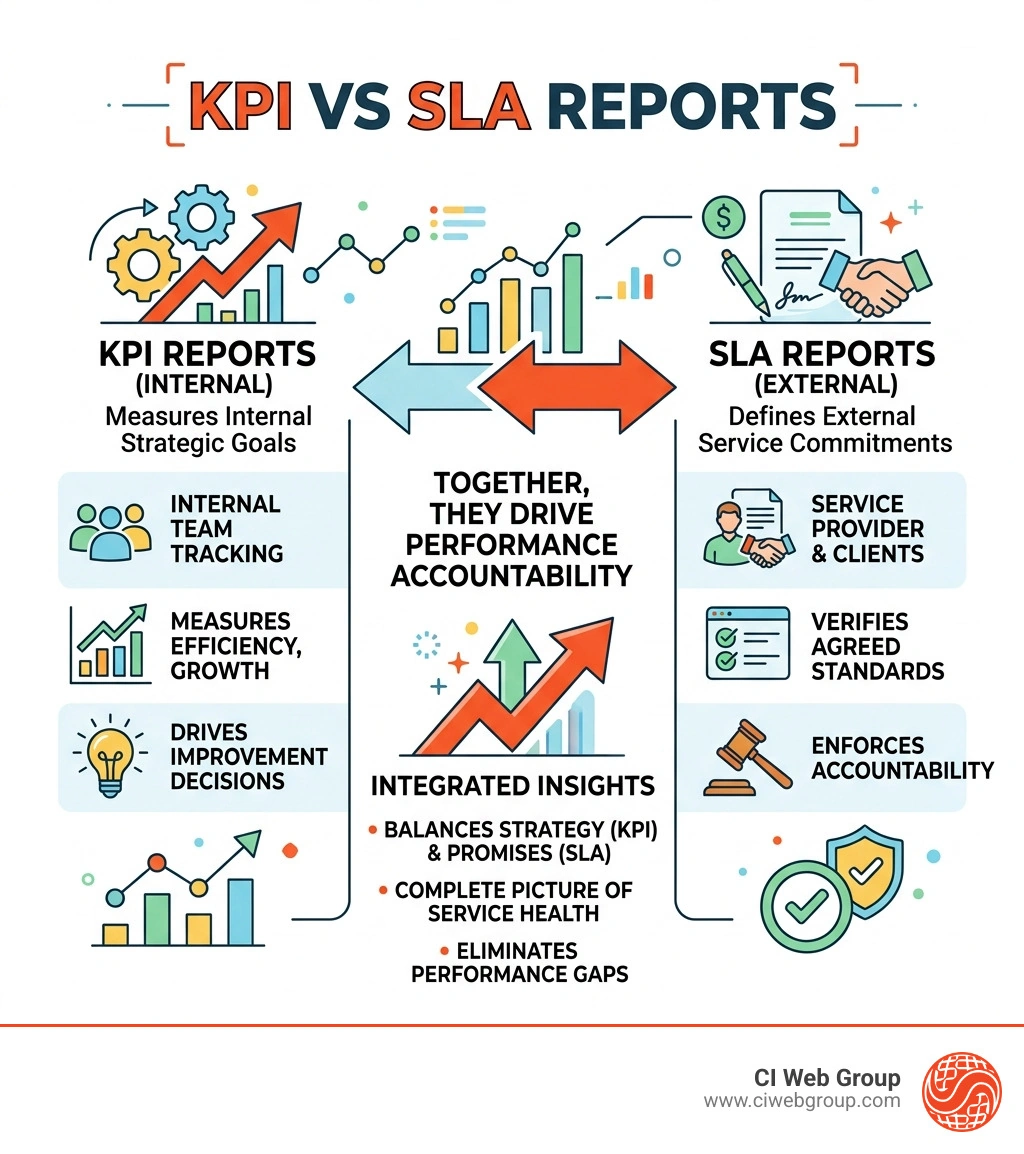
KPI and SLA reports are two distinct but deeply connected tools that organizations use to measure performance and manage service commitments. Here is a quick breakdown of the difference:
| KPI Reports | SLA Reports | |
|---|---|---|
| What it is | Internal metric tracking progress toward business goals | Contractual record of service level commitments |
| Who uses it | Management, internal teams | Service providers and their clients |
| Purpose | Measure efficiency, growth, and strategic success | Verify and enforce agreed service standards |
| Scope | Broad, strategic | Specific, operational |
| Consequences | Drives improvement decisions | Breaches may trigger penalties or remedies |
In short: SLAs define the promise, and KPIs prove whether it was kept.
Most businesses track one or the other — and that is exactly where performance gaps sneak in. When you only have SLAs, you know your targets but may miss the early warning signs of a breach. When you only have KPIs, you have great data but no formal accountability structure to back it up. Together, they create a complete picture of service health and business performance.
I'm Jennifer Bagley, CEO of CI Web Group, and I have spent my career helping home service businesses and contractors use data — including KPI and SLA reports — to make smarter decisions, align their teams, and drive measurable growth. Let me walk you through exactly how these reports work and how to use them together effectively.
Kpi and sla reports word roundup:
As of April 2026, the complexity of managing a home service or IT-driven business has reached new heights. We often see business owners getting tangled in "alphabet soup," but distinguishing between these two reporting types is vital for your bottom line.
While both involve numbers, their DNA is different. A KPI (Key Performance Indicator) is your internal compass. It tells us how well we are doing against our own high standards and long-term vision. An SLA (Service Level Agreement), on the other hand, is the "handshake." It is a formal commitment between a provider and a customer that defines exactly what level of service is guaranteed.
Understanding the metrics every leader should know starts with recognizing that KPIs measure the efficiency of your journey, while SLAs measure the integrity of your promises.
In service management, these reports serve as the ultimate accountability partners. KPI and SLA reports allow us to move away from "gut feelings" and toward data-driven reality.
By creating KPI reports, we can identify bottlenecks in our service delivery before they lead to a breach of contract.
Data is only useful if it leads to growth. We believe that every metric should tie back to your ROI and long-term strategy. If your SLA guarantees 99.9% uptime for your digital booking system, but your KPI shows that your customer acquisition cost is skyrocketing, there is a misalignment.
We focus on essential KPIs for home service digital marketing to ensure that your technical performance (the SLA) actually supports your business goals like revenue growth and market dominance. When these are aligned, your reports don't just show numbers; they show a path to scaling your business.
Whether you are managing a fleet of HVAC technicians in Houston or a technical support desk in the Southeast, incident management is where the rubber meets the road. Tracking how quickly and effectively you handle problems is the difference between a lifelong customer and a one-star review.
Common metrics we track in kpi and sla reports include:
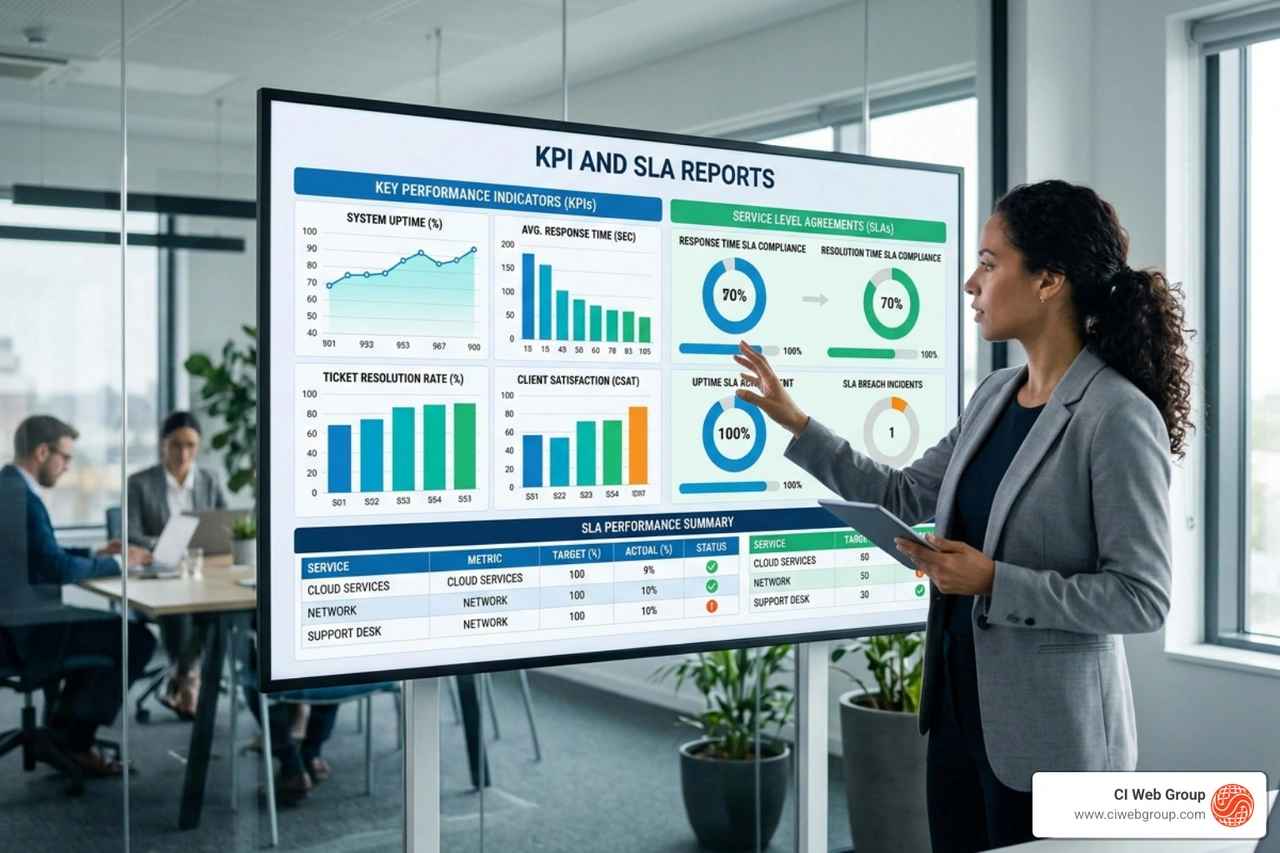
Monitoring these reporting metrics for home service success allows us to see exactly where the service chain is strongest.
An effective SLA isn't just a document; it’s a framework for trust. To be useful, it must include:
Think of it as a daily sales performance report guide but for your service quality. It sets the baseline of what is acceptable.
KPIs act as an early warning system. If your SLA says you must resolve all "Priority 1" tickets within four hours, your KPI report might show that your average resolution time is creeping up from two hours to three and a half.
By monitoring this daily KPI report, you can see the trend toward a potential SLA breach before it actually happens. Real-time monitoring and threshold alerts allow managers to reallocate resources—perhaps moving a technician from a routine maintenance job to an emergency repair—to ensure the promise to the customer remains unbroken.
Setting up your reporting shouldn't be a "set it and forget it" task. We recommend following the SMART goal framework: Specific, Measurable, Achievable, Relevant, and Time-bound.
Stakeholder alignment is also critical. Your field technicians, office staff, and management must all agree on what a "success" looks like. Without this alignment, data silos form, and the reports become meaningless.
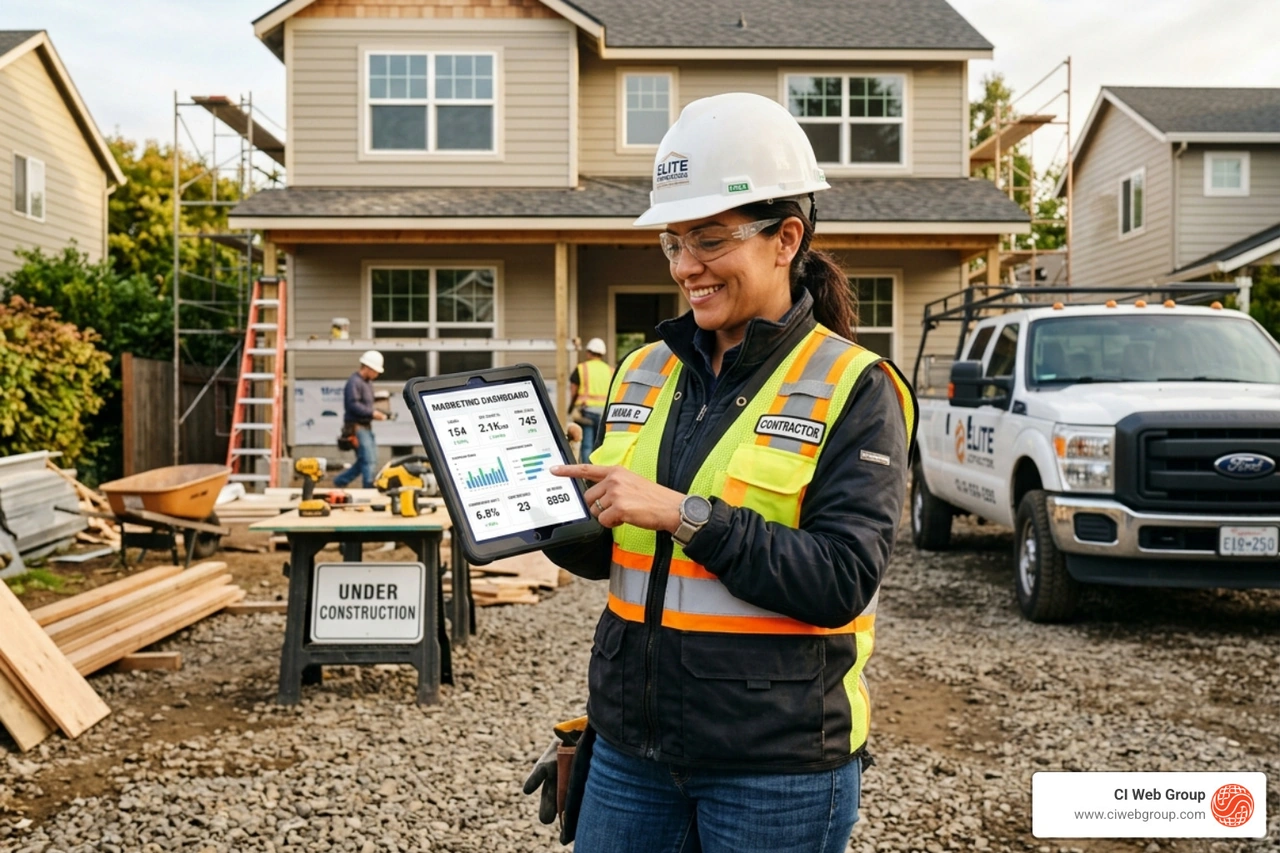
When we help set up marketing dashboards for contractors, we focus on making the data visible and actionable for everyone on the team.
Data is only as good as its visualization. In 2026, tools like Zabbix, InvGate, and Rootly have made it easier than ever to see performance at a glance.
A well-designed corporate performance dashboard uses trend analysis to show not just where you are, but where you are headed. It uses colors (green, yellow, red) to instantly signal when a metric is drifting away from the target.
One of the biggest traps we see is the use of "vanity metrics." These are numbers that look good on paper—like total website hits or total tickets closed—but don't actually tell you if the business is healthy or if the customer is happy.
Another challenge is data silos. If your marketing data doesn't talk to your service data, you might be over-spending on leads for a service your team is currently too backlogged to fulfill. We solve this through funnel analytics and measurement, ensuring that every part of the business is working in harmony. Continuous improvement is the goal; your reports should evolve as your business grows.
In the world of April 2026, waiting for a quarterly review is often too late. For critical services, real-time monitoring via dashboards is the standard. However, we recommend a deep-dive review at least monthly to look for long-term trends. Quarterly reviews should be reserved for high-level strategic adjustments and renegotiating SLA terms with vendors or clients.
Absolutely. You can track internal performance independently of any external contract. For example, you might track the KPI of "employee turnover" to ensure your team is happy, even though you don't have a contract with your employees that guarantees a specific retention rate. KPIs are for your own strategic evaluation, whereas SLAs are for external accountability. This is similar to how you might compare GLSA vs traditional PPC for your business—you track the performance (KPIs) of both to see what works best for your internal goals.
The stakes for reliability have never been higher. According to research from the Ponemon Institute, the cost of datacenter downtime averages roughly $9,000 per minute. This staggering figure is why SLAs in the IT and cloud sectors often aim for "four nines" (99.99%) or even "five nines" of reliability. For a home service business, the cost might not be $9,000 a minute, but a missed emergency call during a heatwave can cost thousands in lost revenue and permanent damage to your reputation.
At CI Web Group, we don't just provide marketing; we provide the clarity you need to dominate your local market. Our data-driven approach is built on transparency and client asset ownership. We believe that kpi and sla reports should be easy to understand and even easier to act upon.
Whether you are in Houston, the Pacific Northwest, or the Southeast, we are here to help you move beyond the acronyms and start using your data to drive real growth. Our customized programs and 24/7 support ensure that your service delivery is always backed by world-class reporting.
Ready to see what your data is really telling you? Explore our CI Web Group Reporting Services and take the first step toward complete transparency in your business performance.
Search our Blog
5 min read
How to Build an HVAC Brand That Doesn't Blow Cold Air
Build a standout HVAC brand with expert Branding for HVAC tips: logos, consistency, digital activation & ROI strategies for 2026 growth.
Read more
5 min read
Beyond the Acronyms: Understanding KPI and SLA Reports
Master KPI and SLA reports: Track performance, ensure compliance, and drive IT service success with essential metrics and best practices.
Read more
5 min read
The New Google Search Is Here: Will Your Home Service Business Still Show Up?
Google just changed Search forever. Discover the 3 critical steps home service contractors must take right now to stay visible to AI search agents.
Read more
5 min read
The Ultimate Contractor Growth Guide
Master digital marketing for contractors in 2026: SEO, PPC, AI search, GEO & reputation strategies to dominate local rankings and scale your business.
Read more