
5 min read
Building Your Commercial Empire: Marketing for Roofing Businesses
Master digital marketing for roofing contractors commercial: SEO, PPC, AI trends & leads to dominate B2B in 2026.
Read more
February 12, 2026
A daily sales performance report is a data-driven summary of your team's key sales metrics—including leads generated, calls made, appointments set, deals closed, and revenue earned—compiled at the end of each business day to provide real-time visibility into sales activities and outcomes. Here's what you need to know:
Core Components of a Daily Sales Performance Report:
Key Benefits:
Every morning, sales managers face a critical question: How did we do yesterday? Without a structured daily sales performance report, you're flying blind—unable to spot emerging problems, capitalize on momentum, or coach your team effectively. High-performing sales teams are 2.8 times more likely to track and analyze their daily sales performance than underperforming teams, yet many home service companies still rely on gut feeling or wait until month-end to understand what's really happening in the field.
The difference between reactive management and proactive leadership often comes down to having the right data at the right time. When you can see yesterday's results this morning—which marketing channels drove the most qualified leads, which sales reps are crushing it, which service categories are trending up or down—you can make informed decisions before the day gets away from you. You can reassign resources, adjust messaging, provide targeted coaching, or double down on what's working while there's still time to impact this week's numbers.
Ready to transform your sales data into strategic advantage? Explore how CI Web Group's reporting solutions help home service companies turn daily insights into consistent growth. Or if you're ready to implement a comprehensive performance tracking system, schedule a strategy session to discuss your specific needs.
The challenge isn't collecting data—your CRM, dispatch software, and payment systems already capture everything you need. The challenge is changing that scattered information into a single, actionable view that tells you what happened, why it matters, and what to do about it. That's where a properly structured daily sales performance report becomes your competitive edge.
I'm Jennifer Bagley, CEO of CI Web Group, and over the past two decades I've helped hundreds of HVAC, plumbing, and electrical contractors build data-driven sales cultures that consistently outperform their markets. Throughout my work developing the 12 Step Roadmap to Accelerated Results, I've seen how implementing a systematic daily sales performance report transforms struggling sales teams into revenue-generating machines by creating transparency, accountability, and a shared focus on what actually moves the needle. Let me show you exactly how to build one that works for your business.

Simple guide to daily sales performance report terms:
An effective daily sales performance report is far more than just a list of numbers; it's a dynamic tool that provides a clear picture of your sales activities, pipeline health, and crucial outcome metrics for a single day. Think of it as your business's daily report card, highlighting exactly what activities were performed and how those activities translate into revenue. It helps us differentiate between what's merely happening and what's truly driving results.
At its core, a robust daily sales performance report relies on Key Performance Indicators (KPIs). These aren't just any metrics; they are the specific, measurable values that demonstrate how effectively your home service team is achieving its objectives. We look at a mix of qualitative and quantitative data—quantitative data gives us the "what" (e.g., how many calls), while qualitative data (e.g., call outcomes, customer feedback) helps us understand the "why." For a deeper dive into understanding these metrics, you can explore our insights on Daily Performance Report.
These metrics give us a pulse on the daily effort and the health of our sales pipeline. They're about the actions our team takes and how effectively those actions move potential customers through our sales funnel.
By carefully tracking these, we gain valuable insights into our Funnel Analytics and Measurement, helping us identify bottlenecks and areas for improvement.
While activity metrics show effort, outcome and revenue metrics reveal the ultimate success of those efforts. These are the numbers that directly impact our bottom line.
These metrics are essential for understanding our Reporting Metrics for Home Service Success and ensuring we're not just busy, but profitable.
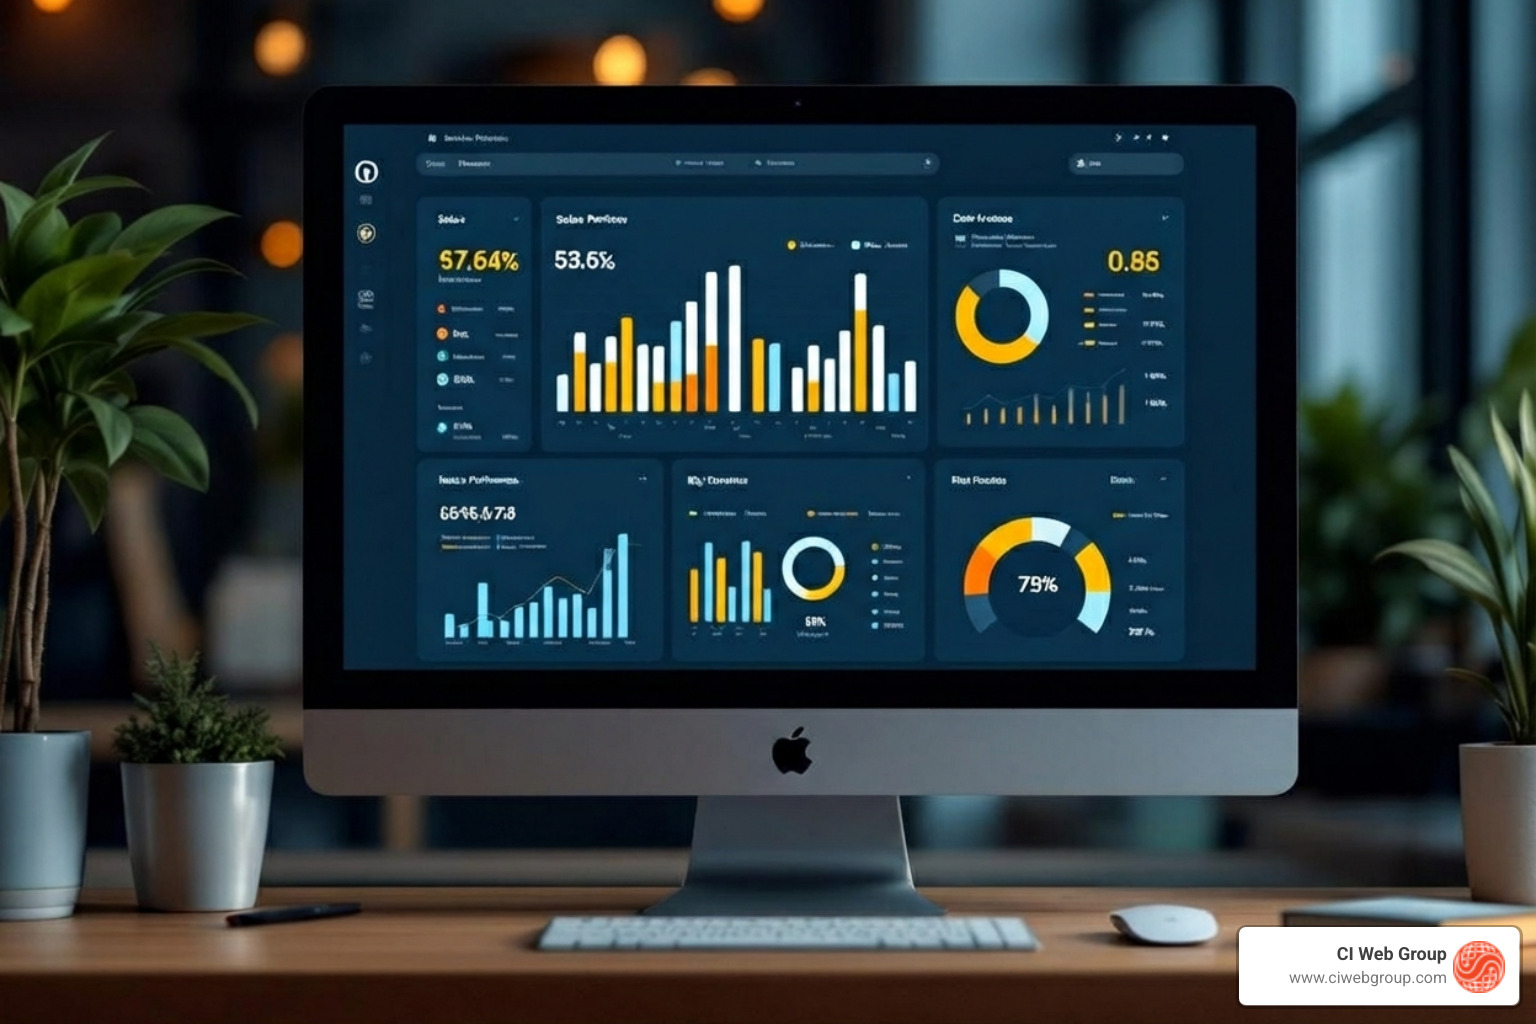
Let's be honest, staring at rows and columns of numbers can be a bit... dry. This is where visual representations truly shine! As we've learned, "Graphical presentation of data in sales reports can simplify dense information and show changes over time immediately." Nobody wants to wade through a "huge line of text" when a clear chart can tell the story in seconds.
By translating our daily sales data into bar charts, pie charts, and line graphs, we can quickly:
Visuals improve understanding, making our daily sales performance report accessible and actionable for everyone, from our field technicians to our senior management. This is why CI Web Group's reporting solutions emphasize clear, intuitive dashboards. For an example of how powerful these can be, check out our insights on a Corporate Performance Dashboard.
Collecting data is just the first step. The real magic happens when we transform that raw data into actionable intelligence—insights that guide our decisions and drive growth. Think of it this way: your daily sales performance report shouldn't just tell you what happened; it should help you understand why it happened and what you can do about it. According to McKinsey, companies that have deployed data-driven B2B sales-growth engines are achieving above-market growth and 15% to 25% EBITDA growth. That's the kind of impact we're aiming for.
This change involves effective data gathering, a structured analysis process, and a keen eye for identifying both opportunities to double down on and potential issues that need swift correction.
For many home service businesses, especially those just starting out, manual data entry into spreadsheets might be the initial approach. It's a workable solution, and we even have access to resources like this free daily sales report template in Google Sheets for basic tracking. However, as our businesses grow across Texas or the Southwest, relying solely on manual processes becomes a bottleneck. Sales reps already spend a significant amount of time on administrative tasks, and manual reporting only adds to that burden.
The best sales teams are moving beyond basic Excel templates to specialized tools designed for tracking daily sales. Automated data collection, often integrated directly with our CRM, dispatch, and accounting software, is the game-changer. This not only saves time but also significantly increases data accuracy. Once collected, our analysis process should include:
This structured approach helps us identify which trends are emerging, whether positive or negative. For a broader understanding of which numbers matter, explore The Metrics Every Leader Should Know.
In today's home service industry, manual reporting is simply not sustainable or efficient. Sales reps only spend 28% of their time selling, with a significant amount of time wasted on manual data entry and reporting. That's a lot of lost revenue! Technology steps in to bridge this efficiency gap.
Digital reporting tools, especially those integrated with our Customer Relationship Management (CRM) systems and dispatch software, offer immense benefits:
By linking our sales data with other business metrics, like those from our marketing campaigns, we gain a deeper understanding of the complete customer journey and how various initiatives impact sales success. This holistic view is crucial for effective AI Marketing ROI Measurement.
Even with the best intentions, implementing a daily sales performance report can face problems. We've seen them all: inaccurate data, low adoption by reps, time-consuming manual processes, and reports that lack context, making them hard to act on.
Here’s how we can overcome these challenges:
A daily sales performance report isn't just about tracking yesterday's numbers; it's a powerful engine for future growth. By providing immediate insights, these reports enable us to refine our sales strategy, drive business expansion, motivate our sales team, and ensure our forecasting is as accurate as possible. It’s about being proactive, not reactive, in our competitive markets across the Southeast, Southwest, and Pacific Northwest.
High-performing sales teams don't just collect data; they use their daily sales reports to inform decisions that drive business growth. This continuous feedback loop is what allows a home service company to adapt quickly and maintain a competitive edge. To understand which KPIs are most crucial for our industry, explore our guide on Essential KPIs Home Service Digital Marketing.
For sales representatives, a daily sales performance report acts as a personal compass. It provides immediate feedback on their efforts, allowing for self-correction and refinement of strategies. Did I make enough calls? Were my proposals effective? Did I achieve my daily sales target? This level of transparency fosters accountability and helps reps take necessary actions to achieve their goals.
For sales managers, these reports are an invaluable coaching tool. They can quickly identify top performers to celebrate and learn from, as well as spot reps who might be struggling. This allows for targeted coaching, addressing specific skill gaps (e.g., closing techniques, lead qualification) rather than generic training. It also helps with improved resource allocation, ensuring our best talent is focused on the most promising opportunities. When we use the report as a tool for support and growth, not just criticism, we build a stronger, more motivated team. This daily feedback aligns perfectly with the insights we share in our Daily KPI Report.
While the "daily" aspect focuses on immediate action, the accumulated data from these reports fuels our long-term strategic planning.
Companies that dynamically adjust their reporting see 27% higher business growth than those with static systems. This agility, born from daily insights, allows us to stay ahead. When presenting these findings to senior leadership, remember to start with an executive summary to highlight the most relevant data and actionable recommendations.
While our focus here is on the daily sales performance report, it's important to understand how it fits into a broader reporting strategy. Different frequencies serve different purposes:
| Report Type | Purpose | Key Metrics Focused On | Best For |
|---|---|---|---|
| Daily | Immediate pulse check, tactical adjustments, individual rep feedback. | Calls made, leads generated, appointments set, daily revenue, deals closed. | Rapid course correction, identifying immediate coaching opportunities, ensuring daily targets are met, spotting sudden anomalies. Crucial for home service teams with active field operations. |
| Weekly | Trend analysis, team performance overview, short-term goal tracking. | Deals closed, revenue collected, lead-to-opportunity ratio, pipeline velocity. | Reviewing progress against weekly goals, comparing individual and team performance over a slightly longer period, making adjustments to weekly sales plans. Good for understanding momentum. |
| Monthly | Strategic overview, long-term trend analysis, forecasting, budget review. | Total revenue, profit margin, customer acquisition cost, sales by service category, overall market trends. | Assessing overall business health, making strategic decisions about marketing spend, service offerings, and staffing, informing future sales goals, and conducting in-depth performance reviews. Excellent for comparing metrics month over month. |
For home service companies, the daily report is paramount because it provides the granular detail needed to manage technicians in the field and respond to customer needs in real-time. It's the foundation upon which effective weekly and monthly reports are built.
For home service companies operating in our regions like Houston, Texas, and the Pacific Northwest, we find the most critical KPIs for a daily sales performance report to be:
These metrics connect our marketing efforts directly to field activity and revenue, providing a comprehensive snapshot of daily operational and sales success.
Getting consistent team adoption for any new reporting process, especially a daily one, requires a smart approach. Here’s how we recommend doing it:
This is a common and important distinction:
Sales Activity Report: This report focuses purely on the actions taken by your sales team. Metrics include the number of calls made, emails sent, meetings scheduled, leads contacted, or proposals delivered. It tells us "what did we do today?"
Sales Performance Report: This report connects those activities to their outcomes. It measures the results of the actions, such as revenue generated, deals closed, conversion rates, average deal size, or profit margins. It answers "what did our actions achieve today?"
While a sales activity report is a component of a comprehensive daily sales performance report, the performance report provides the critical context. It tells us not just that we made 50 calls, but how many of those calls led to appointments, and ultimately, how much revenue those appointments generated. This holistic view is essential for understanding true effectiveness and making informed strategic decisions.
In the dynamic world of home services, staying ahead means being agile, informed, and proactive. A well-structured daily sales performance report is not just an administrative task; it's a fundamental business intelligence tool that provides the pulse of your daily operations. It empowers your team with real-time feedback, enables managers to coach effectively, and provides leadership with the insights needed to refine strategy and drive sustainable growth.
By embracing a data-driven culture, you gain a significant competitive advantage. You move beyond guesswork, making decisions based on facts, identifying opportunities, and addressing potential issues before they escalate. This commitment to continuous improvement, fueled by precise daily data, is what transforms good intentions into exceptional results.
At CI Web Group, we specialize in helping home service companies like yours leverage data to achieve remarkable growth. We believe in complete transparency, client asset ownership, and customized programs designed to help you dominate online search and achieve your goals.
Ready to stop guessing and start growing? Let us help you implement a powerful daily sales performance report system that will transform your sales operations. Get actionable insights with advanced reporting and ensure every day is a step towards your biggest business ambitions.
Search our Blog
5 min read
Building Your Commercial Empire: Marketing for Roofing Businesses
Master digital marketing for roofing contractors commercial: SEO, PPC, AI trends & leads to dominate B2B in 2026.
Read more
5 min read
Your Reputation, Your Revenue: Effective HVAC Review Management
Master HVAC review management to boost local SEO, customer trust, and revenue. Learn strategies for growth.
Read more

5 min read
What is the best brand of AC unit for my forever home
Choose the ideal AC for your forever home. Compare top brands, SEER2 ratings, and understand Best HVAC branding for trust.
Read more

5 min read
Get Your Phone Ringing: Google Ads Strategies for Plumbers
Master Google Ads for plumbers in 2026: Drive emergency leads, optimize campaigns & scale ROI in Dallas. Get your phone ringing now!
Read more