
5 min read
The Complete Guide to Plumbing Website Design
Discover expert plumbing website design strategies that boost conversions, mobile performance, and local SEO for your plumbing business.
Read more
November 12, 2025
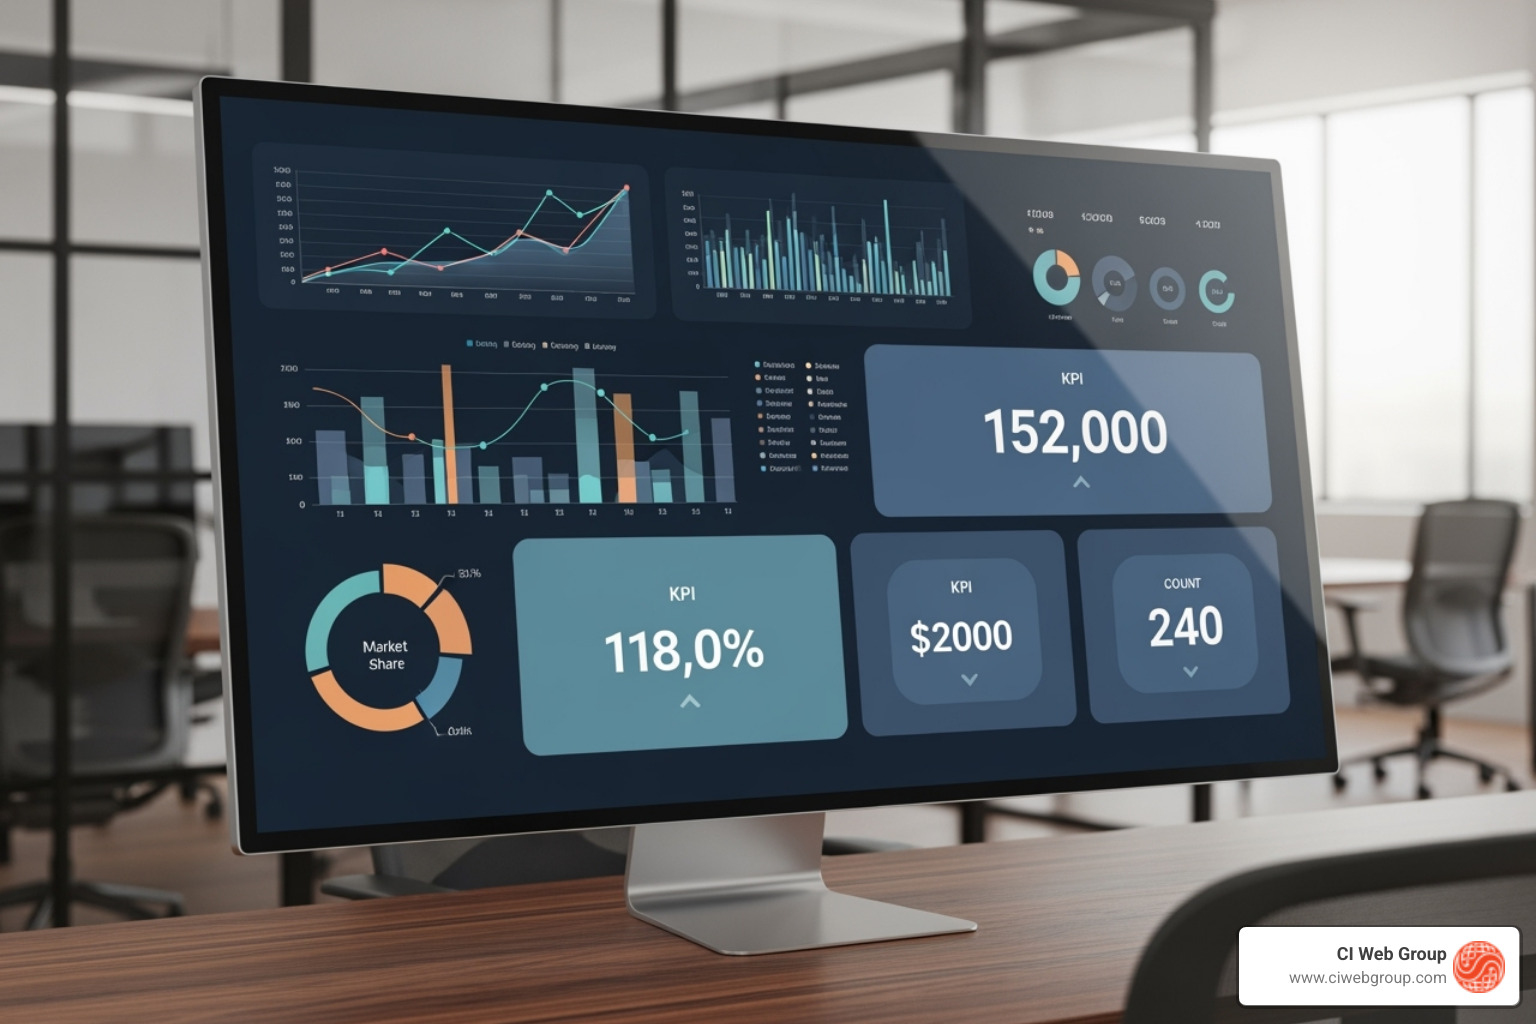
A corporate performance dashboard is a visual business intelligence tool that consolidates key performance indicators (KPIs) from multiple data sources into a single, real-time interface, enabling leaders to monitor organizational performance, make informed decisions, and drive strategic action.
Quick Answer for "What is a corporate performance dashboard?":
Many business leaders spend hours hunting for data across multiple systems, trying to piece together a coherent picture of company performance. This scattered approach wastes time and leads to decisions based on incomplete information. The solution is a corporate performance dashboard.
A well-designed dashboard creates a single source of truth that aligns your organization. It surfaces problems before they become crises, helps allocate resources effectively, and frees your team from manual reporting to focus on what moves the business forward. Research shows that companies effective at dashboarding see significantly higher net profit margins and revenue growth compared to their peers.
Whether you're a CEO, CFO, or department head, a dashboard puts actionable data at your fingertips. I'm Jennifer Bagley, CEO of CI Web Group, and I've spent years helping home service companies transform scattered data into clear insights. In this guide, I'll show you how to build a dashboard that drives real business results.
 feeding into a centralized corporate performance dashboard, which then enables three key outcomes: faster decision-making with real-time insights, improved accountability through shared visibility, and strategic alignment via goal tracking - corporate performance dashboard infographic")
Running a business without clear data is like driving with a foggy windshield—you might miss important signs and take wrong turns. A corporate performance dashboard clears the view. It transforms mountains of business data into a real-time command center, displaying your critical metrics in one place. Instead of hunting through spreadsheets, you get clear, centralized data that shows exactly where you stand.
The impact goes beyond convenience. Research from MIT CISR shows that organizations highly effective at dashboarding see significantly higher profit margins and revenue growth. It's not just about charts; it's about building a business that can adapt and win. You can explore how dashboarding pays off in real business outcomes.
A modern corporate performance dashboard is a visual representation of your key performance indicators (KPIs) that updates in real-time. Through clean charts and graphs, it helps you spot trends and patterns instantly. The real power is its role as a single source of truth. When everyone looks at the same dashboard, they work from the same facts, eliminating debates over whose numbers are right.
As comprehensive business intelligence tools, modern dashboards are customizable for different teams and support goal tracking against strategic objectives. To learn which metrics matter most, check out The Metrics Every Leader Should Know.
In today's environment, dashboards are essential. They drive improved decision-making by providing real-time access to key metrics, allowing you to respond to issues immediately, not weeks later. This fosters a data-driven culture and enables several key advantages:
For home service companies, this visibility can mean the difference between steady growth and missed opportunities.
Not all dashboards serve the same purpose. A CEO needs a different view than a frontline manager, so choose the right type of dashboard for the job.

Performance dashboards fall into three categories: strategic, tactical, and operational. Together, they create a system that drives business growth, fosters team alignment, and increases visibility across all functions.
The three types differ in their time horizon, audience, and level of detail.
| Feature | Strategic Dashboards | Tactical Dashboards | Operational Dashboards |
|---|---|---|---|
| Time Horizon | Long-term (months to years) | Mid-term (weeks to months) | Short-term / Real-time (hours to days) |
| Primary Users | C-suite executives, senior leadership | Department heads, middle management | Frontline managers, team leaders |
| Focus | Overall organizational health, future direction | Departmental goals, project progress | Day-to-day activities, immediate performance |
| Key Metrics | High-level KPIs (e.g., net profit margin, market share, revenue growth) | Trend analysis, budget adherence, campaign performance | Real-time alerts, production rates, customer service response times |
| Purpose | Inform long-term planning, measure overall success | Monitor progress towards strategic goals, adjust strategies | Identify immediate issues, enable quick corrective actions |
A well-implemented corporate performance dashboard delivers tangible benefits that impact your bottom line.
Automated reporting eliminates hours of manual work pulling data and compiling spreadsheets. This leads directly to significant time savings and error reduction, as dashboards connect to data sources automatically. One consultant noted their dashboard "quickly provides key multi-channel performance metrics in one digestible report."
This automation and shared visibility also lead to improved communication and better resource allocation. With everyone working from a single source of truth, teams can have more productive conversations and make smarter decisions about where to invest time and money. For example, seeing which marketing channel has the best ROI allows for quick budget shifts to maximize impact.
These advantages contribute to increased revenue growth. Faster decisions, better resource allocation, and improved team alignment drive better business outcomes. For home service companies, robust reporting can reveal hidden opportunities that directly improve profitability. Learn more in our guide on Reporting Metrics for Home Service Success.
Creating a corporate performance dashboard that gets used requires a focus on user experience (UX). A poorly designed dashboard is confusing and will be ignored. The goal is to create an intuitive tool that integrates seamlessly into your team's daily routine.

When the design is right, people don't just track numbers; they understand the story behind them, ask better questions, and take action faster.
An effective dashboard must have the right features to turn data into insights. Key components include:
Building a great dashboard is an ongoing process. Follow these best practices for success:
The goal is to build something useful, learn from user feedback, and continuously improve it over time.
A corporate performance dashboard is only as powerful as the metrics it tracks. The goal is to focus on Key Performance Indicators (KPIs) that connect directly to your strategic objectives and generate actionable insights.

The right metrics answer your most important business questions: Are we growing? Are we profitable? Are our customers happy? Are our operations efficient?
While specific KPIs depend on your industry, most businesses track metrics across these core categories:
The right metrics depend on the user's role and what decisions they need to make.
For home service businesses, a custom corporate performance dashboard is a competitive advantage. We help clients across the United States track metrics crucial to their success, such as lead sources and volume, cost per lead, and booking rate (the percentage of leads that become appointments). They also monitor average job value, technician efficiency, and customer review scores. By integrating marketing data with their CRM, we provide complete revenue attribution, showing exactly which marketing investments generate revenue, not just leads. This allows for confident budget allocation and rapid opportunity identification. For more on this, explore our guide on Funnel Analytics and Measurement.
The corporate performance dashboard is evolving from a simple reporting tool into an intelligent system that predicts what's next. The future of business intelligence is already reshaping strategic decisions. Here are the key trends to watch:
These advancements aim to make data more intelligent and actionable. The dashboard of tomorrow won't just report on the past; it will illuminate the path forward, empowering every team member to make smarter decisions.
A corporate performance dashboard is more than a reporting tool; it's a strategic asset that transforms scattered data into a clear, real-time narrative of your business. By creating a single source of truth, dashboards enable smarter, faster decisions, align teams, and drive a data-driven culture. We've explored the different types of dashboards, the essential components for effective design, and the importance of choosing the right KPIs. We've also dug into best practices for implementation and looked ahead to an AI-powered future.
For home service companies, a robust reporting platform is the first step toward dominating your market. At CI Web Group, we specialize in turning complex data into actionable insights that empower you to achieve your business goals.
Ready to transform your data into a powerful engine for growth? Find out how our reporting solutions can provide the clarity and control you need to succeed: https://www.ciwebgroup.com/reporting/.
Search our Blog
5 min read
The Complete Guide to Plumbing Website Design
Discover expert plumbing website design strategies that boost conversions, mobile performance, and local SEO for your plumbing business.
Read more

5 min read
5 Ways to Find a Reliable Plumber Fast
Discover plumbing website content strategies that help homeowners find a reliable plumber fast with mobile-friendly design and trust signals.
Read more

5 min read
The Definitive Guide to HVAC Vehicle Wraps
Discover how HVAC vehicle wraps boost brand visibility, generate leads, and build trust with professional fleet graphics that deliver lasting marketing results.
Read more

5 min read
Step-by-Step Guide to Reliable Pest Control Marketing
Discover how pest control marketing services can boost local visibility, generate leads, and drive recurring revenue with proven strategies for 2026.
Read more